top of page

We are pleased to announce that icometrix is now a GE HealthCare company. Click here to learn more.


Like icobrain, brain biomarker measurements need to be extremely reproducible and sensitive enough to detect relevant clinical changes.
Like icobrain, brain biomarker measurements need to be extremely reproducible and sensitive enough to detect relevant clinical changes.
Max Wintermark, Radiologist at Stanford University Medical Center
Key scientific publications

Other solutions
.png)
Multiple Sclerosis
Accurately visualize lesion and brain volume changes over time in multiple sclerosis

Dementia and Alzheimer's
Supporting differential diagnosis and monitoring of atrophy in dementia
.png)
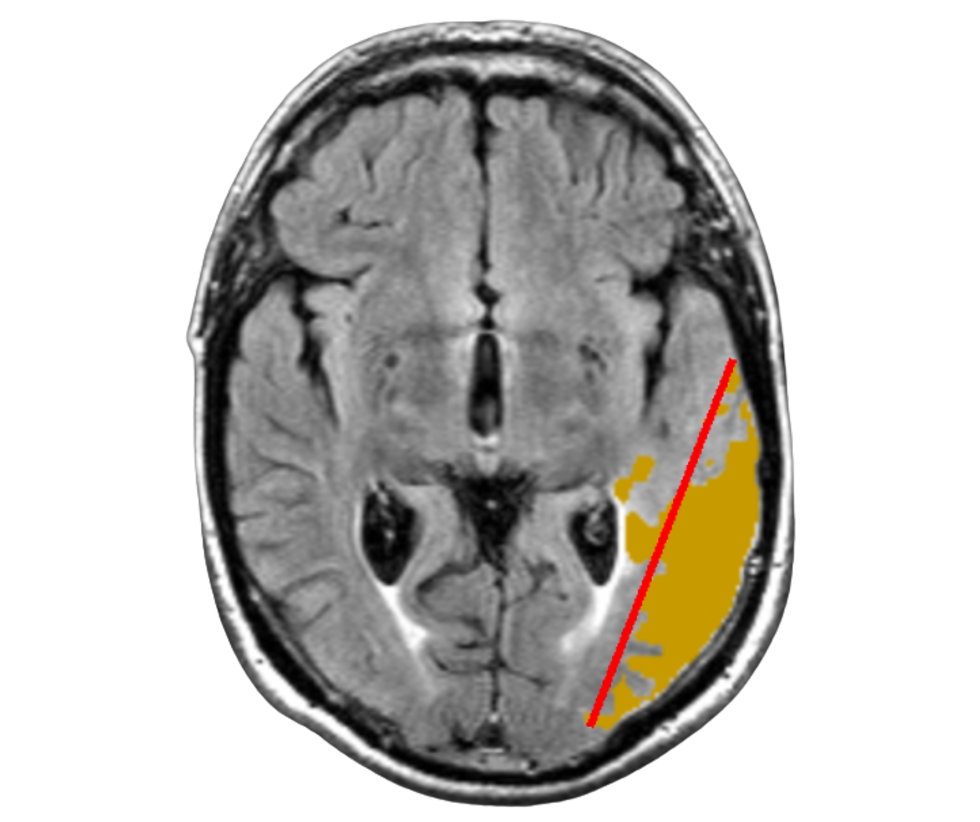
Amyloid-related imaging abnormalities
Detect, measure and grade ARIA-E and ARIA-H
.png)
Traumatic brain injury
Quantify traumatic brain injury and track structural changes
.png)
Epilepsy
Supporting differential diagnosis of epilepsy through abnormality patterns
.png)
Stroke
Measure stroke lesion volumes and perfusion abnormalities
.png)
Parkinson’s disease
Quantifies volumes of basal ganglia, brainstem, cerebellum, cortex, and ventricles.
.png)
Brain tumors
Track changes in tumor resection cavity, core, and edema
Disease-specific solutions that impact outcomes
%20(1).png)
.png)
%20(1).png)
%20(1).png)
%20(1).png)
%20(1).png)
%20(1).png)
bottom of page